New merge document process for building reports
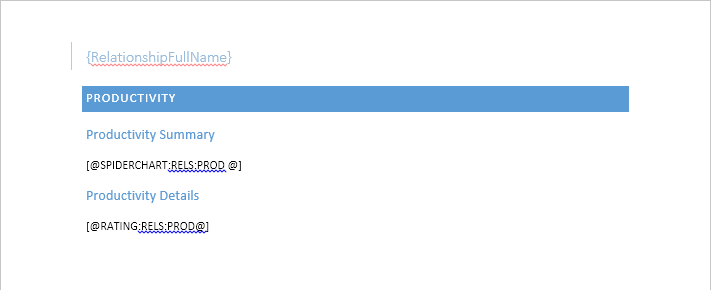
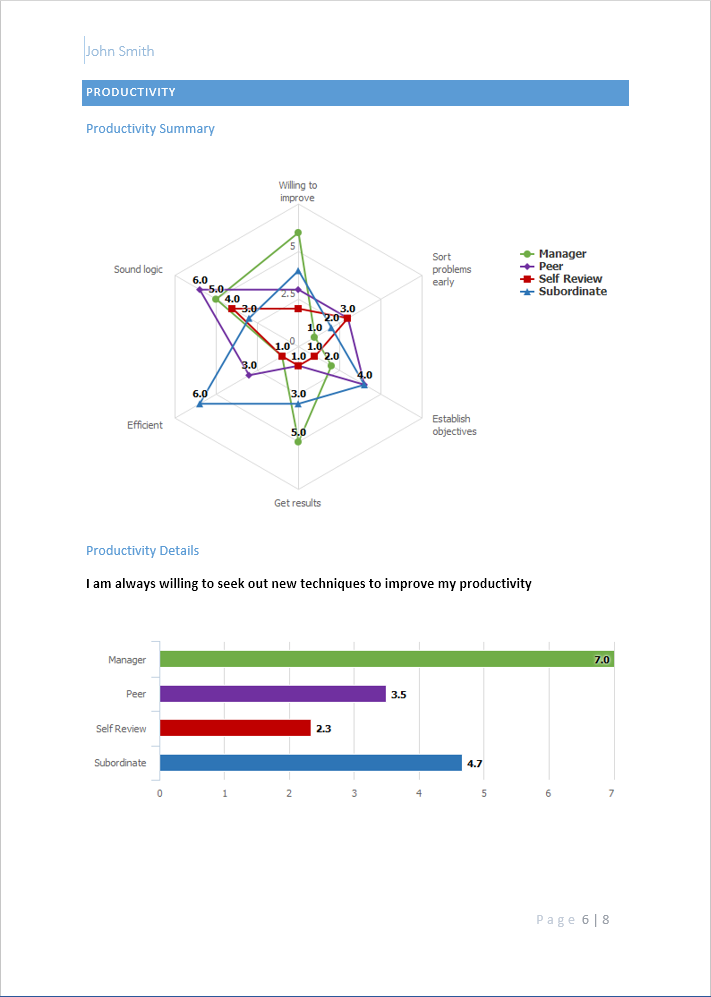
360 Reports are now created with a great new merge system allowing for complete customisation of the document in Word. A user assisted scripting process then allows for 360 data to be presented either by chart or data value in the document.
Integration symbols are entered in the merge document like in the example below [@chart:relationships:competencies@].

These symbols are then defined by scripts in the templating engine.

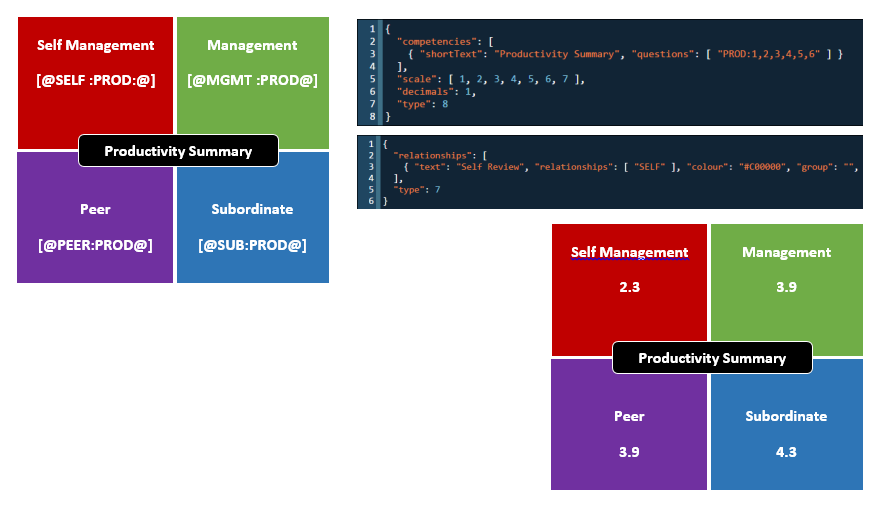
Relationships can be defined to use custom coloring, grouped and renamed.

Competencies can be created to use different text to the questions in the survey, the scoring scale can be adjusted, questions can be grouped to create summary data.

Great looking graphs are then created and rendered into the document.

Individual data values can be generated using the same scripting process to create unique and interesting visual representations of the data.

